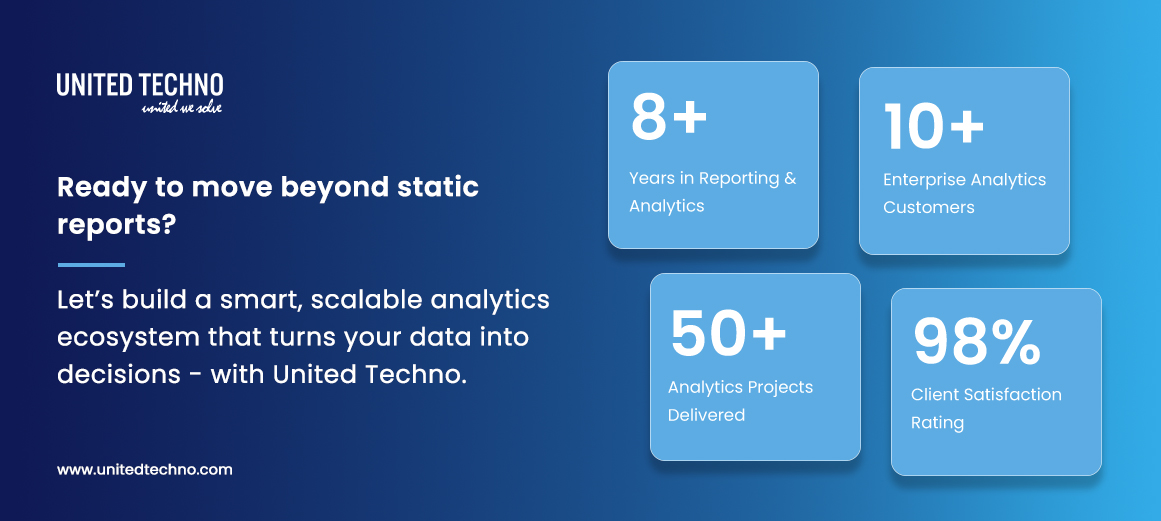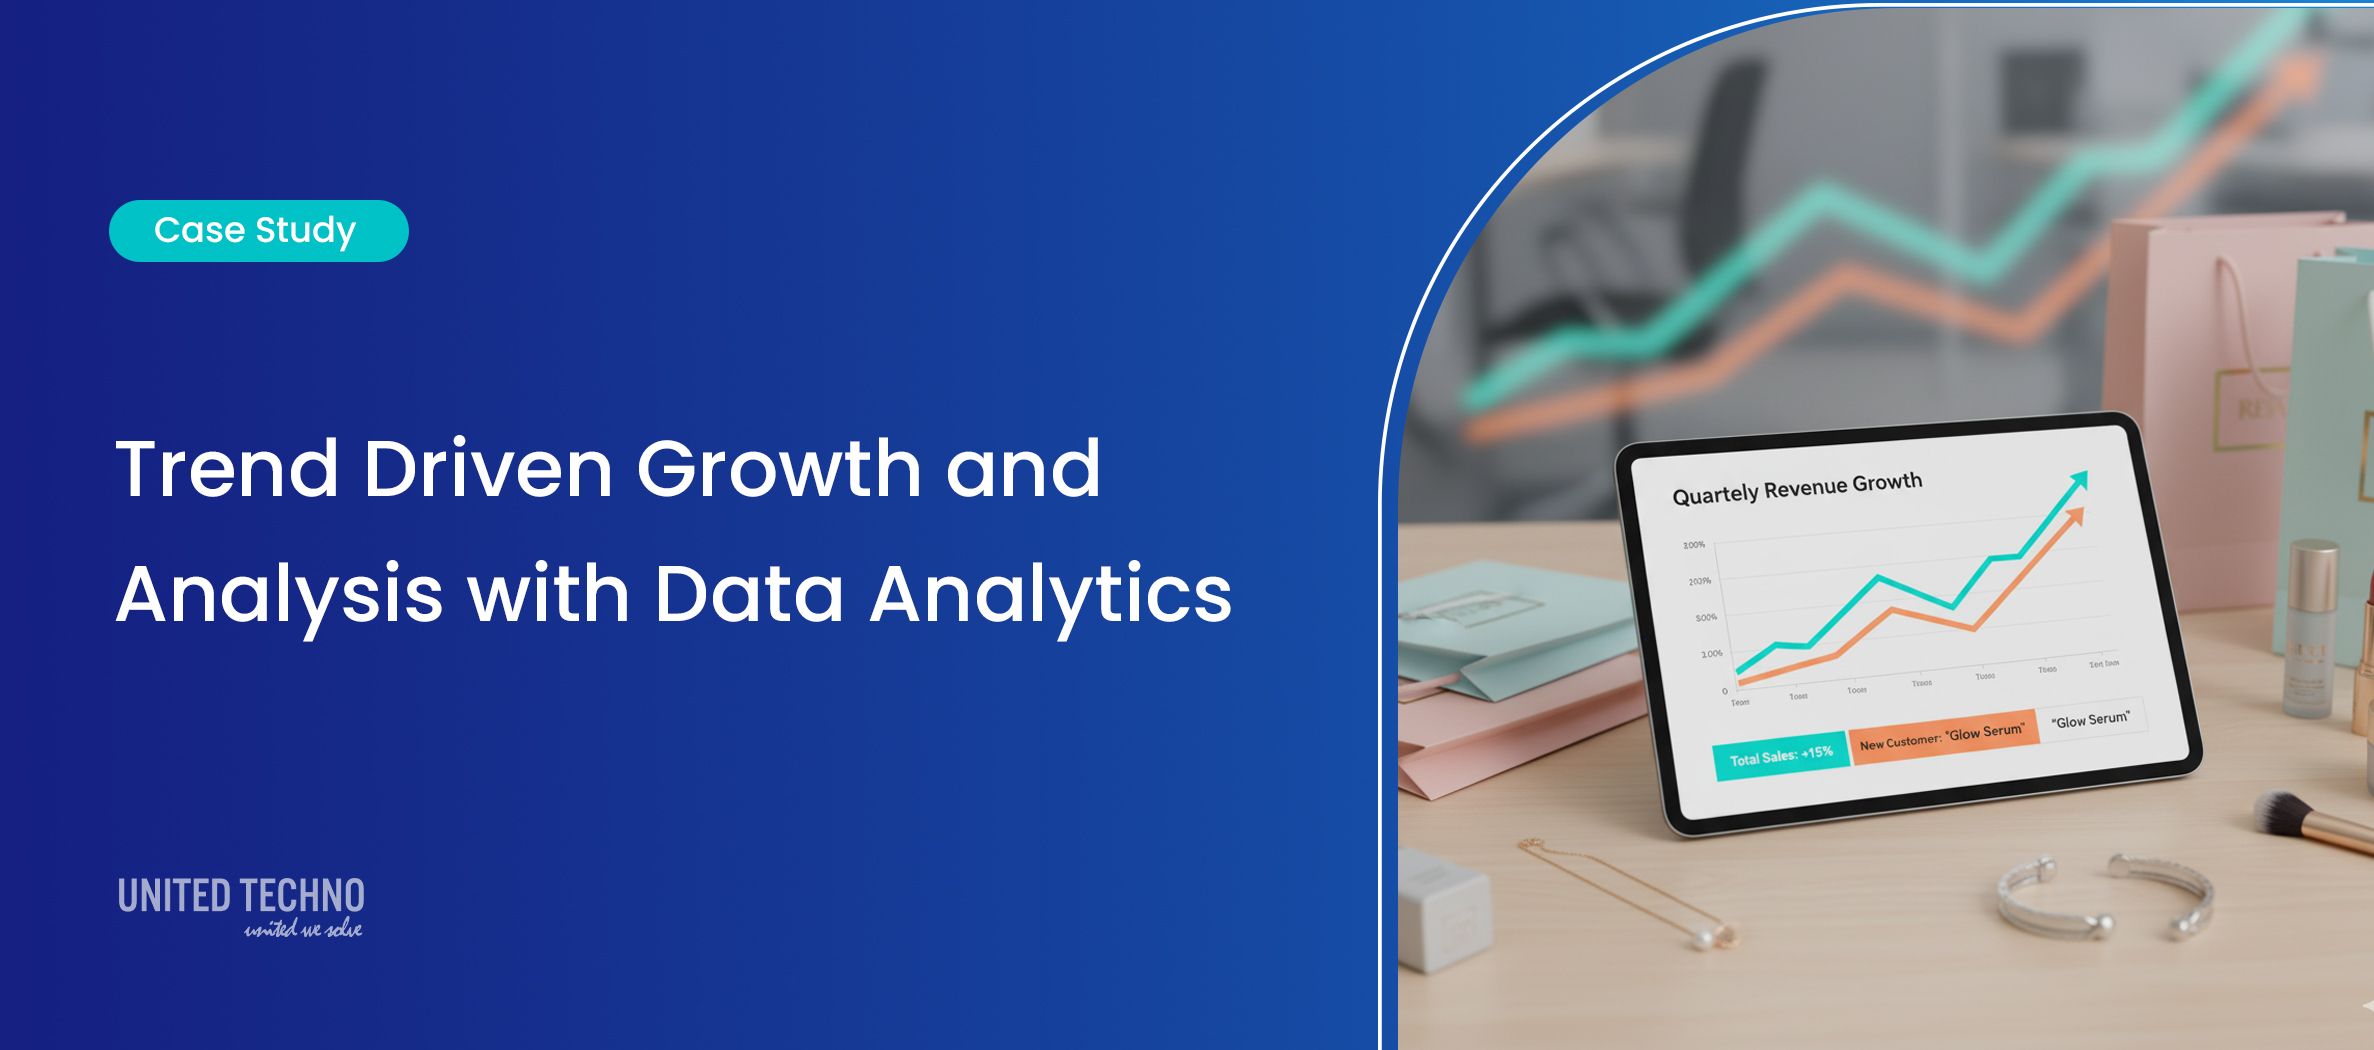
Data Driven Trend Analysis & Data Analytics Solution for Retailers
Are you looking for more than just dashboards? See how a home textiles company partnered with United Techno to turn complex data into actionable insights with Azure and Power BI.
Project Overview
The client is a global retailer specializing in trendy accessories, jewellery, and beauty products for tweens, teens, and young adults. They operate over 2,300 stores worldwide and maintain a strong e-commerce platform.
They partnered with United Techno to improve reporting and analytics. Using Azure and Power BI, the team built dashboards and paginated reports that give real-time visibility into store-level sales, operations, and customer activity. This allows the client to make informed decisions, act quickly, and provide better customer experiences.
Business Challenges
Fragmented visibility
- Sales were tracked, yes, but across multiple reports. To see what was happening at just one location, managers often had to pull together three or four separate files. By the time those numbers made it into a PowerPoint deck for leadership, they were already outdated.
- This lack of a single source of truth made it nearly impossible to act quickly. Underperforming stores weren’t flagged in time. Promotions that worked in one region weren’t replicated fast enough elsewhere. Everyone was looking at numbers, but not the same numbers.
Manual inefficiency
- Behind the scenes, analysts spent hours stitching together spreadsheets. Data had to be pulled manually, cleaned manually, and sent manually. Each step was a chance for errors to creep in. And when errors did show up? Meetings often began not with action items but with debates about which version of the report was “correct.”
- Meanwhile, the clock was ticking. A promotion that needed a fast decision could lose its momentum before leadership even saw the numbers.
Limited flexibility for deeper analysis
- Marketing teams wanted to dig into customer segments. Operations wanted to cross-check sales against inventory. Finance wanted better visibility into markdowns. But the static format of the existing reports made it hard to go beyond surface-level numbers. Exporting to Excel was clunky. Adding calculations slowed systems down. Every new question meant starting over.
- In a fast-moving retail environment, that lack of flexibility became a real handicap.
Missed opportunities with trend response
- Perhaps the biggest pain point was agility. The retailer’s core audience – young, trend-sensitive shoppers, was influenced heavily by social media. A single TikTok trend could make a product line explode overnight. Yet without real-time visibility, by the time leadership noticed the spike, shelves were often empty.
- The reverse was also true. Seasonal products sometimes lingered past their peak. Without accurate forecasting and fast reporting, stores had to resort to markdowns, leaving revenue on the table.
United Techno’s Solution Approach
United Techno implemented a reporting and analytics solution that addressed these challenges:
- Power BI Paginated Reports were built with sub-report functionality, allowing drill-down from division to store level.
- Data refreshes were automated daily and weekly using Azure Logic Apps, so reports could be delivered without manual intervention.
- Reports were structured to be Excel-compatible, supporting further analysis.
Business Objectives
The project aimed to:
- Analyze customer data to guide marketing campaigns and product recommendations.
- Forecast sales trends to optimize stock allocation.
- Monitor inventory in real time to reduce losses from unsold or expired items.
- Evaluate store performance to inform layout and expansion strategies.
- Improve online user experience and integrate digital and physical channels.
Technologies & Platforms
Business Impacts and Outcomes – Data Driven Trend Analysis & Data Analytics Solution for Retailers
The solution delivered practical benefits:
- Promotions based on analytics helped boost sales of high-potential products.
- Stock optimization reduced out-of-stock situations and markdowns, saving an estimated $5 to 10 million annually.
- Personalized insights helped improve customer satisfaction, increasing Net Promoter Scores by 10 – 15%.
- Trend analysis allowed the team to respond quickly to seasonal and social media-driven demand.
Services Provided
- Data advisory and reporting strategy
- Azure integration and automation
- Power BI dashboards and paginated report development
- UX/UI design and corporate branding alignment
- Automated report distribution (PDF/Excel)
- Post-implementation support
Value Delivered
Working with United Techno gave the client a clear view of sales, operations, and stores without manually combining data.
Decisions that once relied on incomplete or delayed information can now be made quickly. Reporting is accurate and compliant, helping strengthen retailer relationships. The system is also built to scale, supporting future growth.
Conclusion
The engagement moved the retailer from fragmented, manual reporting to a unified analytics system. Automated dashboards and reports allow teams to spend less time preparing data and more time acting on insights. Our data analytics solution for retailer helped to uncover trends, optimize operations, and drive smarter business strategies. From integrating multiple data sources to generating actionable insights, we helped our clients to turn raw data into measurable growth.
Struggling with outdated reports or disconnected data? United Techno can help turn your analytics into a reliable business tool. Talk to our data analytics experts today!
Why United Techno?
United Techno combined technical skill with practical retail experience. The team built a reporting framework that refreshes automatically, scales as the business grows, and provides reliable insights. UT’s expertise in Power BI and Azure, coupled with a clear understanding of retail operations, ensured the reporting system is easy to use and supports the client’s goals.